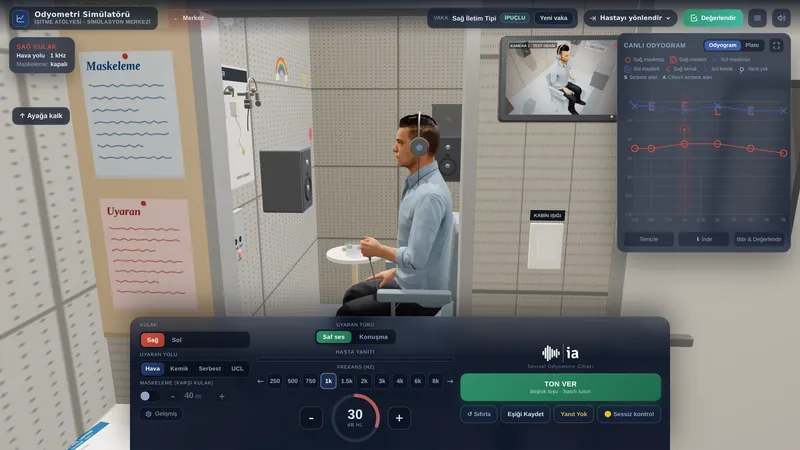
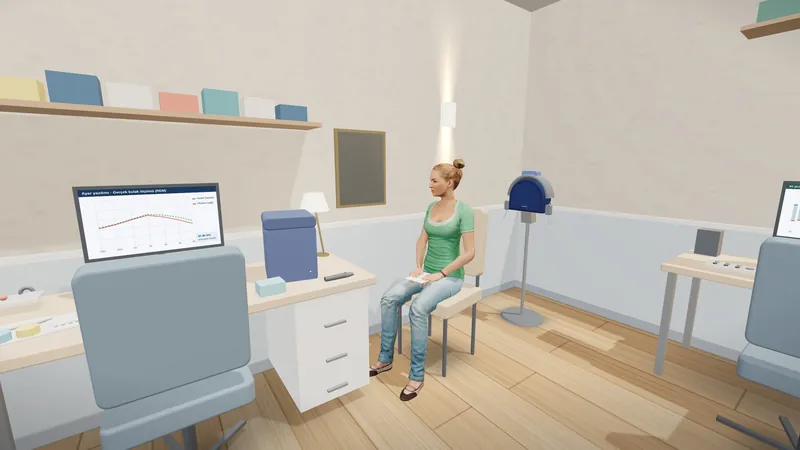
Headphones recommended.It also works on a phone; panels sit side by side on wide screens and stack on phones. Start with the volume low.
SIMULATOR · HEARING LOSS

Hearing Loss Simulator

Listen to speech, music, the Ling sounds or your own recording through the hearing loss you choose. Pick a ready-made audiogram or mark the thresholds on the audiogram yourself; the sound is reprocessed according to the conductive and sensorineural components, loudness recruitment and reduced frequency selectivity. You can also add the listening environment, a hearing aid, tinnitus and age-related change.

For education · not an exact copy of what a person with hearing loss hears

  • 17 preset audiogramsfrom conductive to neuropathy
  • Microphone recordinghear your own voice
  • Processed in the browseraudio is never uploaded
1Listen

Pick a sound, pick an audiogram, hear the difference

First, in Normal hearing mode, set the volume so the sound is as comfortable as someone talking in front of you. Then switch to With hearing loss; each change reprocesses the sound and playback continues where it was.

Audiogram Normal hearing
Tap or drag on the chart to mark thresholds
Enter values in a table

Empty frequencies are estimated from their neighbours. Without bone conduction values, the loss is treated as sensorineural.

Preset audiogramsapplied to both ears
ListenLoading sound
Audibility
Ling-6 sounds1 m, normal voice

✓ audible · ~ partly: some of it is audible but not the part that tells it apart · ✕ inaudible

2Settings

Beyond the audiogram: how, where and with what?

Start the sound with the player below, then change the settings: the sound is reprocessed with each change and carries on from where it was with the new setting. Switch between Normal and With loss to compare. The player stays at the top of the screen while you move through the settings; go back to section 1 to change the sound.

· Loading sound
Change sound

In sensorineural loss, damage to the outer hair cells disturbs the cochlea's natural compression. The threshold rises, but loudness catches up quickly at high levels: soft sounds disappear, loud sounds are still uncomfortable. Conductive loss has no such effect; the sound is only attenuated.

Frequency
Frequency selectivity

As auditory filters widen, nearby frequencies can no longer be separated; vowel formants blur and noise fills the gaps in speech more easily. That is why raising the volume does not fully restore clarity.

3Exercise

What did you hear?

A sentence is played through a random hearing loss. Type what you heard; then see the correct sentence, the words you missed and which loss was used. It is an awareness activity for families, teachers and students.

0 / 0
Add your own sentence

Record a sentence with the microphone and type how it is written. The sentence is added to the pool only while this page is open; it is never uploaded. Useful for sentences a teacher prepares in their own voice.

4Share

Link, import and audio file

Share your settings as a link, bring an audiogram over from the Audiogram Tool, or download the processed sound to use in teaching.

Link

The audiogram, the sound source (except your own recording) and all settings are written into the link.

Audiogram Tool

Paste the link you copied with “Copy link” in the tool; air and bone conduction thresholds are brought over. You can also open this page's audiogram in the tool.

Audio file (WAV)

Downloaded as a two-channel (right and left ear) WAV. All versions share the same scaling, so the difference between them is kept.

5How it works

What it shows and what it does not

Why turning the volume down is not enough

In sensorineural loss the problem is not only audibility. Outer hair cells amplify soft sounds and separate frequencies sharply; when they are damaged the threshold rises, loudness catches up quickly at high levels, and frequencies blur together. That is why the simulator splits sensorineural loss into two parts: the outer hair cell part is processed as level expansion (loudness recruitment), the inner hair cell part as plain attenuation.

Conductive and sensorineural components

When bone conduction is entered, the air-bone gap is treated as the conductive component and only attenuates; the bone conduction threshold itself is the sensorineural component. Without bone conduction, the whole loss is treated as sensorineural. Type and degree use the pure-tone average of 500, 1000, 2000 and 4000 Hz, as in the site's other tools.

Why the sound level matters

The simulator assumes the chosen sound reaches the ear at a given level (for example 65 dB SPL for normal speech) and applies the thresholds accordingly. Because the level of your headphones is unknown, setting the normal hearing version to a natural loudness brings the result closer to reality.

Speech Intelligibility Index (SII)

SII gives how much of speech is audible, weighting each frequency band by its contribution to intelligibility, on a 0 to 1 scale (ANSI S3.5-1997). The standard speech spectrum and the one-third octave method are used here; spread of masking is not included. SII is not a percentage of understanding: an SII of 0.5 can correspond to very different scores depending on context and talker.

Reading the live spectrum

During playback the audiogram shows the momentary level of the sound reaching the ear in one-third octave bands. On an audiogram, lower means louder: bands that drop below the threshold line are audible, bands that stay above it (in the shaded area) are not. Levels are given relative to each band's normal hearing threshold so they can be compared on the chart, and are approximate.

Limits

This is a teaching tool and is not for diagnosis or choosing a device. The frequency response of your headphones, room reverberation and your own hearing change the result. Central auditory processing, attention, cognitive load and lip-reading are not modelled. Two people with the same audiogram do not hear in the same way either.

Frequently asked questions

Does the simulator reproduce exactly what a person with hearing loss hears?

No. It simulates audibility, loudness recruitment and reduced frequency selectivity with published methods, but the brain adapts to a loss over years and two people with the same audiogram do not hear alike. The aim is to give an intuitive sense of what a loss does to sound.

Why are headphones recommended?

The right and left ears are processed separately; one-sided or asymmetric loss, the talker's direction and ear-specific tinnitus can only be heard correctly with headphones. On speakers the two channels mix in the room, and small speakers cannot reproduce low frequencies.

How should I set the volume?

Play the female talker in the “Normal hearing” version and set your device volume so it sounds like someone talking normally in front of you. Then switch to the other versions without touching it. Turning it up too far makes the loss sound milder than it is.

Is my microphone recording sent anywhere?

No. Recording and all processing happen inside your browser; the sound is never uploaded and is gone when you close the page. Recordings are not written into the share link either.

Why does the hearing aid version not fix the sound completely?

The aid restores audibility, but the suprathreshold effects of sensorineural loss, recruitment and blurred frequencies, continue in the cochlea. The aid's upper frequency limit and compression also limit some detail. The difference is clearer in noise.
References
  1. Moore BCJ, Glasberg BR. Simulation of the effects of loudness recruitment and threshold elevation on the intelligibility of speech in quiet and in a background of speech. J Acoust Soc Am. 1993;94(4):2050-2062.
  2. Baer T, Moore BCJ. Effects of spectral smearing on the intelligibility of sentences in noise. J Acoust Soc Am. 1993;94(3):1229-1241.
  3. Nejime Y, Moore BCJ. Simulation of the effect of threshold elevation and loudness recruitment combined with reduced frequency selectivity on the intelligibility of speech in noise. J Acoust Soc Am. 1997;102(1):603-615.
  4. Pichora-Fuller MK, Schneider BA, MacDonald E, Pass HE, Brown S. Temporal jitter disrupts speech intelligibility: a simulation of auditory aging. Hear Res. 2007;223(1-2):114-121.
  5. ANSI/ASA S3.5-1997. Methods for Calculation of the Speech Intelligibility Index. Acoustical Society of America.
  6. ISO 7029:2000. Acoustics: Statistical distribution of hearing thresholds as a function of age.
  7. ISO 1999:1990. Acoustics: Determination of occupational noise exposure and estimation of noise-induced hearing impairment.
  8. ISO 226:2003. Acoustics: Normal equal-loudness-level contours.
  9. Byrne D, Dillon H. The National Acoustic Laboratories' (NAL) new procedure for selecting the gain and frequency response of a hearing aid. Ear Hear. 1986;7(4):257-265.
  10. Kujawa SG, Liberman MC. Adding insult to injury: cochlear nerve degeneration after “temporary” noise-induced hearing loss. J Neurosci. 2009;29(45):14077-14085.
  11. Ling D. Foundations of Spoken Language for Hearing-Impaired Children. Alexander Graham Bell Association; 1989.

Speech samples: Mozilla Common Voice (CC0). Music, Ling sounds and everyday sounds were synthesised for this page; “Für Elise” (Beethoven) is in the public domain.

Try it in the simulator

© 2026 Ahmet Alperen Akbulut, Auditory Scene. All rights reserved. It may not be copied, reproduced or distributed without permission.This covers the simulator's software, sound processing model, synthesised sound samples and images. For permission requests: info@isitmeatolyesi.com