
 Auditory Scene
Audiometry Simulator
Take the virtual patient from the 3D clinic room into the sound-treated booth, carry out the preparation steps and present the stimulus yourself. Find air- and bone-conduction thresholds with the Hughson-Westlake method; recognise cross-hearing, mask the non-test ear and do not skip the inter-octave frequencies. Switch to speech mode and measure the SRT, the word recognition score and speech in noise. When you finish, compare your audiogram with the true thresholds, see your errors and download your clinical report.
Works on computers and tablets · headphones recommended
- 11 clinical cases
- 3D clinic room
- 3 practice modes
- Air + bone conduction
- Speech audiometry
- Masking
- PNG / PDF report
Before you start
Four short notes to help you get accurate results from the simulator and protect your own hearing.
Computer or tablet
The simulator does not open on a phone screen: the console, the booth and the audiogram do not fit on the same screen, so small screens are deliberately blocked. Hold your tablet in landscape orientation.
Headphones preferred
The stimulus is presented to one ear; if you work with loudspeakers, the right/left separation and masking lose their meaning. The headphones are not calibrated; the sounds are correct only in relative terms.
Raise the volume gradually
The device can go up to 120 dB HL; above 100 dB, an on-screen warning asks you to confirm. Start with your system volume at a medium level and raise it slowly if needed.
For educational use
This is a simulation; it does not replace a clinical diagnostic tool, a calibrated audiometer or a hearing test. The report it produces is not a medical document.

How does it work?
The flow of a real audiometry session: choose the case, present the stimulus, record the threshold, complete the assessment with speech tests, compare the result.
-
1
Choose the case and the mode
Choose one of the 11 clinical cases or the blind case. There are three practice modes: Learning (a guide that explains what to do at each step and why), Guided (you work freely; teaching hints appear when needed) and Field (warnings only for obvious errors). You also choose the patient's cooperation (Reliable or Variable). If you wish, start with the Weber and Rinne tuning fork pre-test.
-
2
Choose the headphones, present the stimulus
Supra-aural or insert? Your choice changes the masking rules: interaural attenuation is 40 dB with supra-aural headphones and 60 dB with insert earphones. Choose the ear and the frequency, then press PRESENT TONE with a short + long rhythm. The patient raises a hand only when the stimulus is presented properly.
-
3
Find the threshold, mask if needed
Go down 10 dB, up 5 dB. Record the threshold once the patient responds to at least half of the presentations; the simulator checks the Hughson-Westlake criterion and warns you if you record too early. If you suspect cross-hearing, present narrowband noise to the non-test ear and find the true threshold with the plateau method.
-
4
Compare and get your report
When you finish the test, the audiogram you plotted is overlaid on the true thresholds: where you forgot to mask, where you recorded a shadow curve, which inter-octave frequency you skipped, each one is shown. If you ran speech tests, their findings are gathered on the same screen. Then download your A4 clinical report as a PNG or PDF.
The clinic room and the patient
The test starts in the clinic room, before the booth. The patient waits for you in the waiting chair; you decide where to take them.
3D clinic room
You can look around the room by dragging or with the arrow keys, and click objects to read information cards that explain why they are there. Clicking the booth takes you to the control room; you watch the test room through the window and on the patient camera monitor. The clinic also has an ABR and OAE room: clicking the OAE desk or the ABR couch takes you to the OAE simulator or ABR simulator together with the patient file.
Preparation steps
Before starting the test, you make four decisions: how to seat the patient, how to fit the headphones, how to give the instructions and where to start the test. Your choices are applied in the 3D scene: if the headphones are put on the wrong way round, the colours are reversed, and a patient who understands the instructions nods.
Realistic patient behaviour
The patient hesitates at levels near threshold and sometimes half-presses the button; as the test goes on, they get tired and their responses slow down. If you always present the stimulus at equal intervals, they may become conditioned to the rhythm and press before the sound arrives. With variable cooperation they may also respond without hearing anything; to catch this, you use Silent catch trial trials.
Plateau graph and patient referral
On the live audiogram, the Plateau tab plots how the threshold changes as the masking noise increases, and shows the undermasking, plateau and overmasking regions. Refer the patient sends the same patient, together with their file and findings, to the Acoustic Immittance Simulator.
Cases
11 cases ordered by difficulty, from normal hearing to suspected retrocochlear pathology. The diagnoses are not spelled out here; you will interpret each case yourself.
There is also a Blind Case option: you test without knowing the pathology and find out at the end.
Speech audiometry
Pure-tone thresholds tell you how much the ear hears; speech tests tell you how much it understands. You switch with the [Pure tone | Speech] toggle on the console: you present the word, the patient repeats it, and you decide whether it is correct or incorrect.
Which tests are there?
-
SATSpeech awareness threshold: the lowest level at which the patient hears that speech is present, even without understanding the words.
-
SRTSpeech reception threshold with three-syllable words. Its agreement with the pure-tone average is written in the report.
-
WRSWord recognition score with a monosyllabic list, at the level you choose.
-
MCL and UCLMost comfortable level and uncomfortable loudness level; the patient tells you verbally.
-
Speech in noiseIn speech noise: a fixed signal-to-noise ratio or an adaptive SNR-50 search.
Tip: speech crosses the head too. For speech, the simulator takes interaural attenuation as 40 dB with supra-aural headphones and 60 dB with insert earphones; you are expected to mask the non-test ear when needed.
Speech in noise
An ear with a normal word recognition score in quiet may struggle in noise. That is why the test has two methods.
- 1Fixed SNRYou set the signal-to-noise ratio; when the list ends, you get the percentage correct in that condition.
- 2Adaptive searchAfter a correct response the SNR goes down; after an incorrect one it goes up. The average of the reversal points gives the SNR-50.
- 3The noise stays fixed on the dialIn the adaptive search, it is the level of the word that changes. This is how it is done in the clinic; raising the dial does not make the test easier, it makes it measurable.
Word lists: six monosyllabic lists and four three-syllable lists for SRT. You can change the list for each test so that the same list is not memorised.
On the results screen, the speech findings are gathered in a separate section: the agreement between SRT and the pure-tone average, the performance-intensity function and, if you measured it, the SNR-50.
Controls and shortcuts
You can also use the console with the mouse, but the keyboard is much faster. Inside the simulator, press ? at any time to open this card.
Keyboard shortcuts
| Space | Present the stimulus (hold down): short + long rhythm |
| ↑↓ | Raise / lower the level by 5 dB |
| ←→ | Change the frequency |
| Enter | Record the threshold (in speech mode, record the result) |
| 120 | In speech mode: correct / incorrect / skip |
| N | Mark as no response |
| C | Silent control trial (reliability) |
| M | Turn masking on / off |
| RL | Switch to the right / left ear |
| ? | Open the shortcut card |
| Esc | Close the open window |
What is on the console?
-
EarRight / left selection; the symbol and colour change automatically.
-
PathwayAir conduction, bone conduction, sound field (loudspeaker) and UCL measurement.
-
StimulusPure tone or warble; pulsed or continuous.
-
Mode switch[Pure tone | Speech]; in speech mode, the test, list and SNR controls appear.
-
TransducerSupra-aural / insert; directly affects the masking rules.
-
Masking dialNarrowband noise to the non-test ear; you set its level.
-
Learning panelRule reminders and warnings in Guided mode.
Tip: while presenting the stimulus, you can change the level without releasing the button, using the ↑↓ keys; the patient responds only to a properly presented stimulus.
Odyogram sembolleri
The simulator uses the internationally recognised symbol set. The right ear is red and uses the circle family, the left ear is blue and uses the cross family; masked measurements are boxed.
maskedBoneBone
maskedNo response
Masking rules: summary
The simulator engine works according to these rules; in Learning mode, it warns you when you break one.
| Rule | Supra-aural | Insert |
|---|---|---|
| Interaural attenuation (IA)The level lost as the sound crosses the head | 40 dB | 60 dB |
| Air-conduction masking criterionDifference between the AC threshold of the test ear and the BC threshold of the non-test ear | ≥ 40 dB | ≥ 60 dB |
| Bone-conduction masking criterionFor bone conduction, IA is taken as ≈ 0; the headphone type does not change this | Air-bone gap > 10 dB or BC threshold difference ≥ 10 dB between the two ears | |
| Occlusion effectImprovement of bone-conduction thresholds at low frequencies when the ear is occluded | 250 Hz30 dB 500 Hz20 dB 1000 Hz10 dB | 250 Hz10 dB 500 Hz10 dB 1000 Hz0 dB |
Plateau method
Increase the masking noise step by step. If the threshold of the test ear stays unchanged for a while (plateau), you have reached the true threshold. If the threshold keeps rising with the noise, you are still on the shadow curve (undermasking) or you have moved into overmasking.
The masking dilemma
With large bilateral air-bone gaps, adequate masking inevitably masks the test ear as well: no safe range is left between undermasking and overmasking.
Most often, switching to insert earphones. When IA rises from 40 dB to 60 dB, a plateau window opens. You will experience this first-hand in the simulator's "Bilateral Conductive" case.
Clinical report output
When you finish the test, your measurements are laid out on a real clinical form.
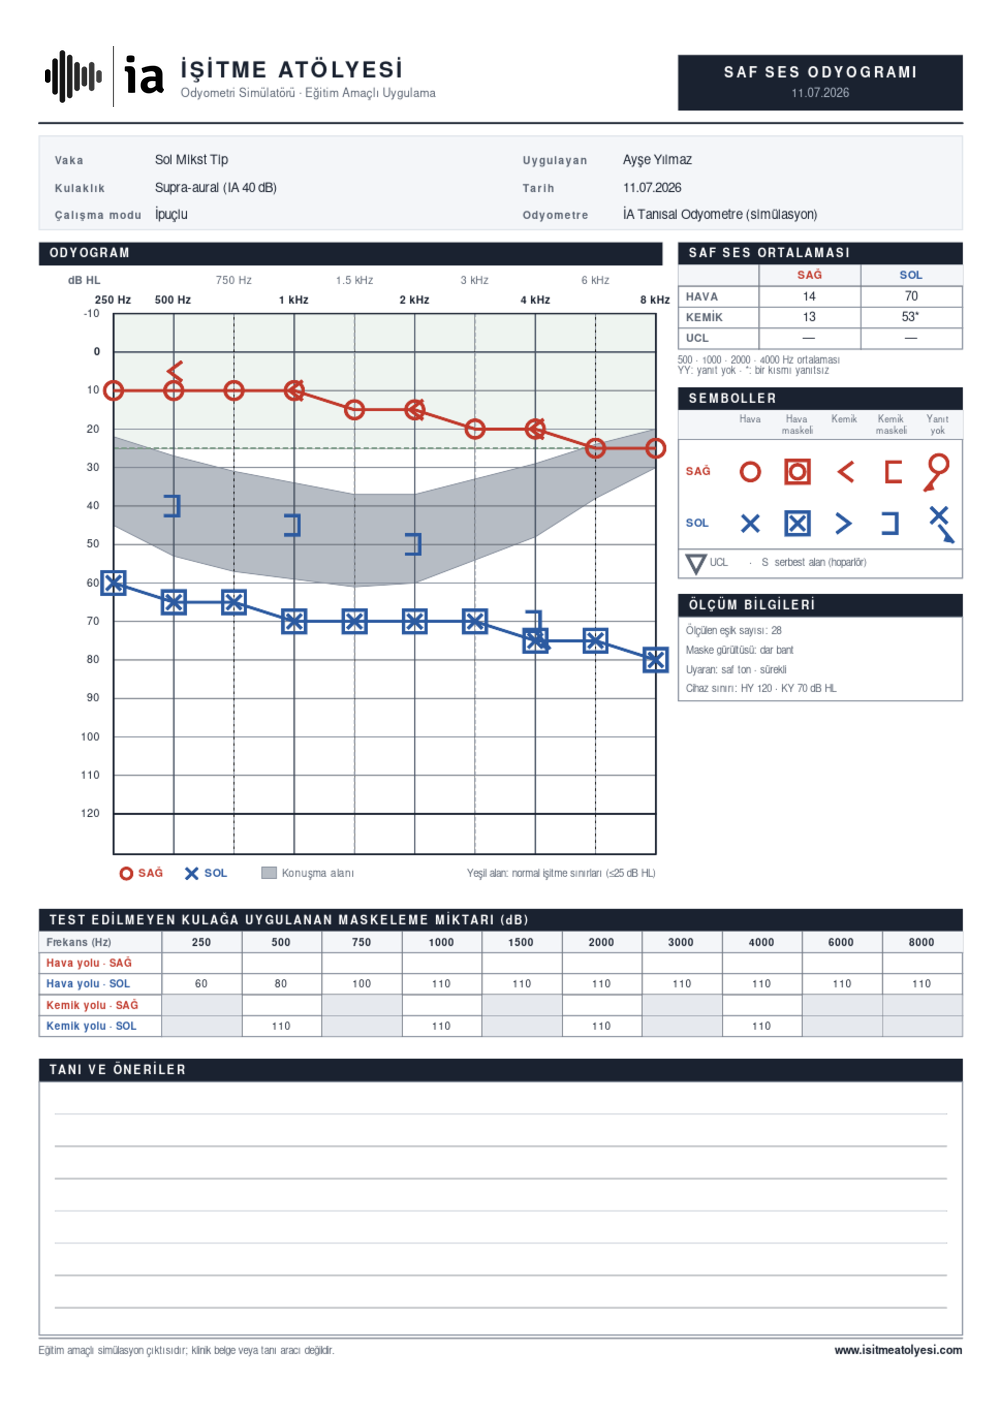
The report follows the layout of a real clinical form: header details, audiogram, averages, masking table and an open assessment area. It is printed as vector graphics, so it stays sharp on paper too.
- AudiogramPlotted with standard symbols; the normal hearing range and the speech banana are shaded.
- Pure-tone averageRight/left PTA for air and bone conduction; if you measured UCL, it is in the table too.
- Masking tableThe amount of masking applied to the non-test ear at each frequency.
- Speech findingsSAT, SRT, word recognition score, MCL, UCL and speech in noise; agreement between SRT and the pure-tone average.
- Header detailsCase, headphone type, practice mode, the name of the tester and the date.
- Symbol legendTogether with the measurement details: stimulus type, masking noise, device limits.
- Diagnosis and recommendationsAn area left blank; you can fill it in by hand and submit it.
For instructors
The simulator is designed for classroom use: you can view a student's session with a single code and build scenarios around your course.
How does class mode work?
- 1The student finishes the testThe case, the mode and all measurements are kept in their browser.
- 2A class code is generatedA short text code that encodes the whole session.
- 3You decode itPaste the code into the decoder in the simulator; the session appears in front of you.
What the code contains: which case, which mode, which thresholds, how many errors, the masking decisions and the response reliability.
No data is sent to a server. The code is generated in the student's own browser; sharing it is entirely up to them.
Suggestions for use in class
-
Warm-up
Normal Hearing case + Guided mode. The aim is to learn the method, not to make a diagnosis.
-
Teaching the rules
Have students do the Left Severe SNHL case without masking first; discuss the shadow curve together, then have them repeat it with masking.
-
Masking Dilemma
Give them the Bilateral Conductive case with supra-aural headphones. When they get stuck, ask them to switch to insert earphones.
-
Speech
Give them the Left Retrocochlear Suspicion case. They should not stop once they have plotted the audiogram; ask them to measure the word recognition score as well and to interpret the two findings together.
-
Assessment
Free mode + class code. Give them a blind case; have them hand in the report and the interpretation together.
-
Homework
Have them complete the "Diagnosis and recommendations" section of the downloaded A4 report.
Frequently asked questions
You start with the better ear and at 1000 Hz. From an audible level, you proceed in 10 dB down, 5 dB up steps (modified Hughson-Westlake). If responses are obtained to at least half of the stimuli presented at the same level (typically two out of three trials), that level is the threshold.
The usual order is 1000 → 2000 → 4000 → 8000 → (1000 again) → 500 → 250 Hz. Repeating 1000 Hz is a reliability check: if it differs from the first measurement by more than 5 dB, the test is repeated. Once air conduction is complete, bone conduction is measured.
For air conduction: if the difference between the air-conduction threshold of the test ear and the bone-conduction threshold of the non-test ear is equal to or greater than the interaural attenuation (40 dB with supra-aural headphones, 60 dB with insert earphones), the sound can cross the head and be heard in the better ear; in that case masking is needed.
For bone conduction: sound reaches the opposite cochlea with almost no attenuation (IA ≈ 0). So masking is used if the test ear has a significant air-bone gap (> 10 dB) or if the bone-conduction thresholds of the two ears differ by ≥ 10 dB.
When you present a high-level sound to the poorer ear, it vibrates the skull and can be heard in the better ear. The patient raises a hand, but has not actually heard the sound with the test ear. This misleading curve, plotted without masking, is known as a shadow curve and typically runs parallel to the better ear's thresholds, about one IA (40–60 dB) below them.
The unilateral profound hearing loss case in the simulator sets exactly this trap: if you do not mask, you find a "60 dB threshold in the left ear", yet the left ear hears nothing at all.
It is the standard up-down staircase method used to search for a threshold. When there is a response, the level is lowered by 10 dB; when there is none, it is raised by 5 dB. This "down 10 / up 5" oscillation produces repeated trials that approach the threshold from below. The threshold is defined as the lowest level at which responses are obtained on at least 50% of ascending trials at that frequency.
The simulator runs this check in the background: if you record a threshold without enough repetitions, it warns you.
If the threshold difference between two adjacent octaves is 20 dB or more, the half-octave frequency between them is also measured. Otherwise the true shape of the curve is missed; in a noise-induced notch in particular, if 3000 and 6000 Hz are skipped, the notch does not show up.
To mask during bone-conduction testing, you place a headphone on the non-test ear. When the ear canal is closed, the bone-conduction threshold at low frequencies improves, meaning the patient hears better than expected. This gain must be added when the masking noise level is calculated.
The effect is marked with supra-aural headphones (~30 dB at 250 Hz) and very small with insert earphones, because the canal is occluded deeply. It is seen in ears with a normal middle ear; in conductive loss it is not expected, because there is already "natural occlusion".
The noise presented to the non-test ear becomes so loud that it also crosses the head and starts to mask the test ear. The threshold of the test ear becomes artificially poorer. The safe range between undermasking and overmasking is the plateau and the true threshold lies there.
The pure-tone audiogram shows the ear's sensitivity but not how well it understands speech. Two ears with the same audiogram can differ greatly in speech recognition. A word recognition score clearly poorer than the thresholds predict is a classic warning sign of retrocochlear pathology.
Speech tests also check the reliability of the pure-tone results: if the SRT and the pure-tone average do not agree, there is a problem with one of the measurements.
Yes. The SRT and the air-conduction average of 500, 1000 and 2000 Hz typically agree within 6 dB of each other; a difference of more than 10 dB is considered a disagreement. If the audiogram slopes steeply, the average of the two best frequencies gives a better comparison.
A disagreement points to one of three things: an error in the pure-tone thresholds, an error in the speech test or a problem with the patient's cooperation.
It is the signal-to-noise ratio at which half of the words are repeated correctly. In the adaptive method, the ratio is made harder after each correct response and easier after each incorrect one; the points where it changes direction are averaged. A normal-hearing ear typically stays at negative values in speech noise.
In the simulator, the noise stays fixed on the dial; what changes is the level of the word. That is why the choice of dial level matters: in an ear with severe loss, a threshold that cannot be found with 65 dB of noise may be found at 85 dB.
No. The simulator runs entirely in your browser; no measurement is sent to a server. Your progress is kept only in your own browser's local storage. The code in class mode is also generated in your browser; whether to share it is up to you.
The audiometer console, the view of the sound-treated booth and the live audiogram need to be on screen at the same time. At phone width this layout stops being usable; pressing the wrong key and recording the wrong threshold become far too easy. That is why small screens are deliberately blocked. Tablets work in landscape orientation.
No. What is tested here is a virtual patient, and you are the tester. The sounds are not calibrated and depend on your computer's volume; do not draw any conclusions about your own hearing. If you are concerned about your hearing, see an audiology clinic.
Kaynaklar
The simulator's acoustic model, masking rules and threshold search method are based on the standard sources below.
- Katz, J. (Ed.). Handbook of Clinical Audiology. Wolters Kluwer.
- Yacullo, W. S. Clinical Masking Procedures. (Clinical masking, the plateau method and the masking dilemma.)
- Gelfand, S. A. Essentials of Audiology. Thieme.
- Roeser, R. J., Valente, M., & Hosford-Dunn, H. (Eds.). Audiology: Diagnosis. Thieme.
- British Society of Audiology. Recommended Procedure: Pure-tone air-conduction and bone-conduction threshold audiometry with and without masking.
- American Speech-Language-Hearing Association (ASHA). Guidelines for Manual Pure-Tone Threshold Audiometry.
- Carhart, R., & Jerger, J. F. Preferred method for clinical determination of pure-tone thresholds. Journal of Speech and Hearing Disorders. (Source of the modified Hughson-Westlake method.)
- ISO 8253-1. Acoustics – Audiometric test methods – Part 1: Pure-tone air and bone conduction audiometry.
- Mungan, S., et al. Türkçe tek heceli ve üç heceli sözcük listeleri [Turkish monosyllabic and three-syllable word lists]. (Source of the material used in the speech tests.)
- American Speech-Language-Hearing Association (ASHA). Determining Threshold Level for Speech and Guidelines for Determining Threshold Level for Speech.
- Carhart, R., & Porter, L. S. Audiometric configuration and prediction of threshold for spondees. Journal of Speech and Hearing Research. (Agreement between SRT and the pure-tone average.)
- Plomp, R., & Mimpen, A. M. Improving the reliability of testing the speech reception threshold for sentences. Audiology. (Adaptive speech-in-noise method.)
- ISO 8253-3. Acoustics – Audiometric test methods – Part 3: Speech audiometry.
If you are ready, let's go into the booth
If you have spotted an error, if a rule is not working correctly, or if there is a case you would like us to add, write to us: info@isitmeatolyesi.com. The simulator is an open-ended educational project; it grows with your feedback.